

Navigating the complex world of trading requires a keen understanding of market dynamics and technical analysis. Among the valuable tools at a trader’s disposal are bearish candlestick patterns, which offer insights into potential trend reversals and market shifts.
This Bearish Candlestick Patterns Cheat Sheet serves as a comprehensive reference, providing to the point explanations and key features of various bearish candlestick patterns. Whether you are a novice trader looking to enhance your skills or an experienced investor seeking a quick guide, this cheat sheet offers a valuable resource to help you make informed decisions in the ever-changing financial landscape.
Top bearish candlestick patterns to learn
1. Bearish Abandoned Baby
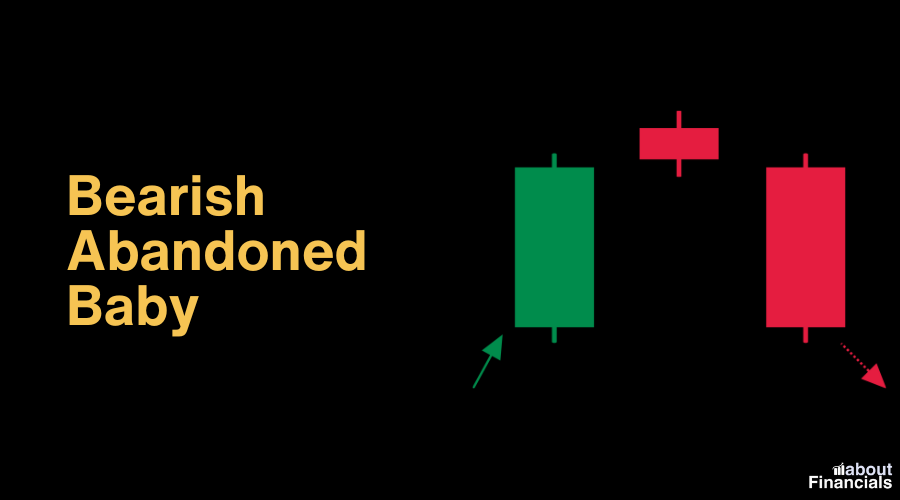
The bearish abandoned baby is a powerful reversal pattern characterized by a gap down after an uptrend. It consists of three candles: a bullish candle, followed by a doji or a small candle with a gap below the previous candle’s close, and then a bearish candle that confirms the reversal. This pattern signals a potential shift from bullish to bearish sentiment, often indicating a change in trend direction.
Use: After a prolonged uptrend, the gap down and the subsequent doji highlight a potential shift from bullish sentiment to bearish sentiment. Look for confirmation in subsequent sessions.
Avoid: In markets with low liquidity or during news-driven events, as gaps may not accurately represent true sentiment.
2. Bearish Three-Line Strike
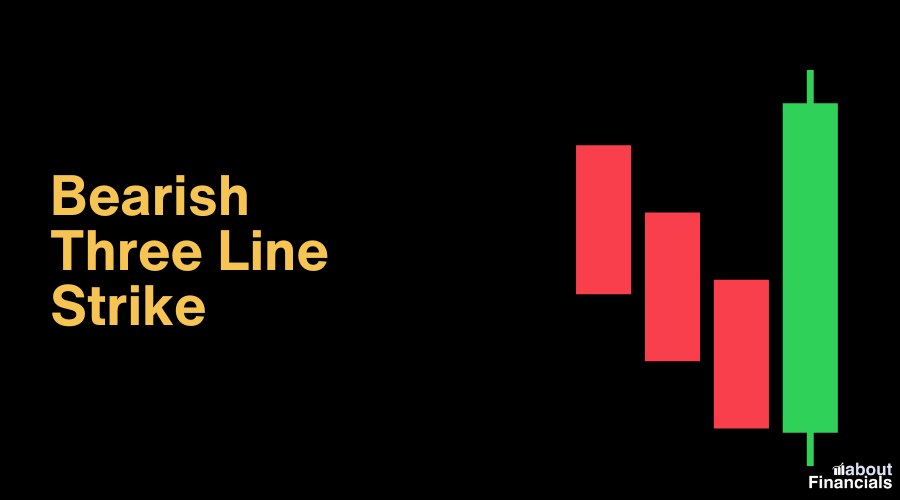
The bearish three-line strike, also known as the three black crows’ counterattack, is a bearish reversal pattern. It comprises four candles: three consecutive bearish candles followed by a large bullish candle that engulfs the previous three candles. This pattern suggests a strong reversal from an uptrend to a downtrend, reflecting increased selling pressure and a potential trend reversal.
Use: In strong uptrends, especially when accompanied by overbought signals from other indicators. The bearish reversal signaled by the bullish candle engulfed by the three bearish candles suggests a potential trend reversal.
Avoid: In sideways markets where consecutive candles show uncertainty and lack of clear trend direction.
3. Bearish Engulfing Pattern
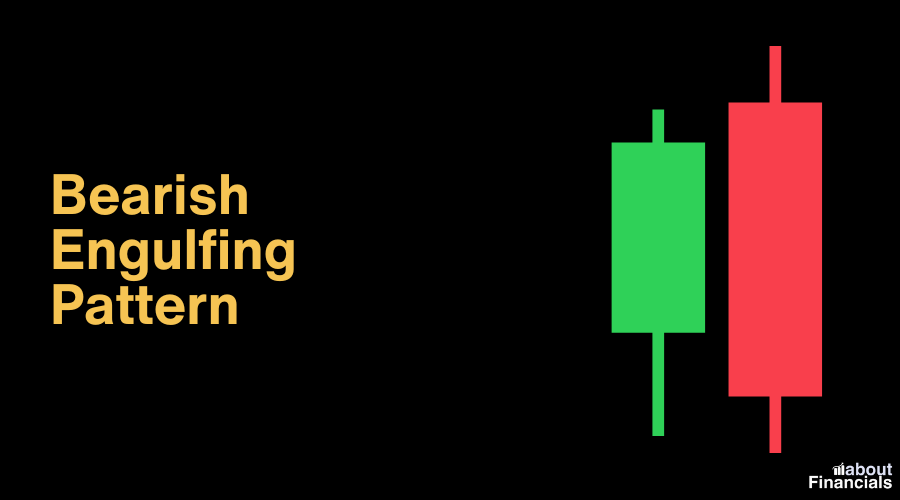
The bearish engulfing pattern is a widely recognized bearish reversal signal. It occurs when a small bullish candle is followed by a larger bearish candle that completely engulfs the previous candle. This pattern indicates a shift in market sentiment, with buyers losing control to sellers. It’s often seen as a sign of impending downward movement or a potential trend reversal.
Use: After an extended uptrend, the larger bearish candle engulfing the previous bullish one suggests a potential shift in momentum. Look for this pattern near key resistance levels.
Avoid: In choppy markets or after a prolonged downtrend, as the pattern’s significance may diminish.
4. Dark Cloud Cover

The dark cloud cover is a two-candle bearish reversal pattern that forms after an uptrend. It begins with a bullish candle, followed by a larger bearish candle that opens above the previous candle’s close and closes below its midpoint. This pattern suggests that the bullish momentum may be waning and that a potential trend reversal or pullback could be on the horizon.
Use: In strong uptrends, the bearish candle opening above the previous close and closing below its midpoint indicates potential reversal. Confirm with other technical indicators.
Avoid: In markets with low volume or during periods of high uncertainty, as the pattern’s reliability could decrease.
5. Evening Star

The evening star is a three-candle bearish reversal pattern. It typically appears after an uptrend and consists of a bullish candle, followed by a small-bodied candle (which could be bullish or bearish), and then a larger bearish candle. The bearish candle closes below the midpoint of the first bullish candle. This pattern signals a potential reversal of the uptrend and a shift towards a downtrend.
Use: After an uptrend, the evening star signals potential exhaustion and reversal. The small-bodied candle indicates hesitation and the subsequent bearish candle confirms the reversal.
Avoid: In rapidly changing markets where quick shifts in sentiment may render the pattern less effective.
6. Bearish Kicking
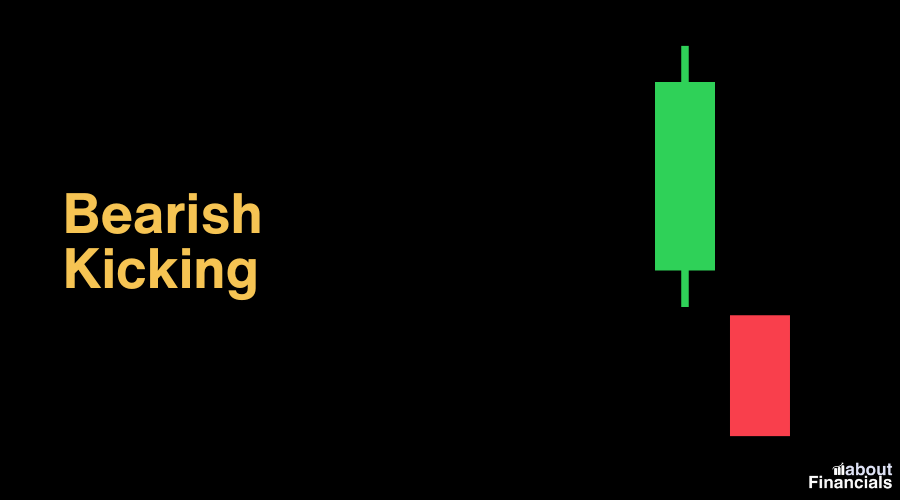
The bearish kicking pattern is a two-candle formation that signifies a swift reversal from an uptrend to a downtrend. It involves a bullish candle on the first day followed by a bearish candle with a gap down on the second day. The bearish candle opens lower than the previous day’s low and closes below the previous day’s open, indicating a strong shift in sentiment.
Use: In strongly overbought conditions, the gap down between the bullish and bearish candles indicates a sudden shift from bullish to bearish sentiment. Consider this pattern when other indicators suggest potential reversal.
Avoid: In trending markets without significant gaps, as the bearish kicking pattern relies on a notable gap down.
7. Bearish Tri-Star
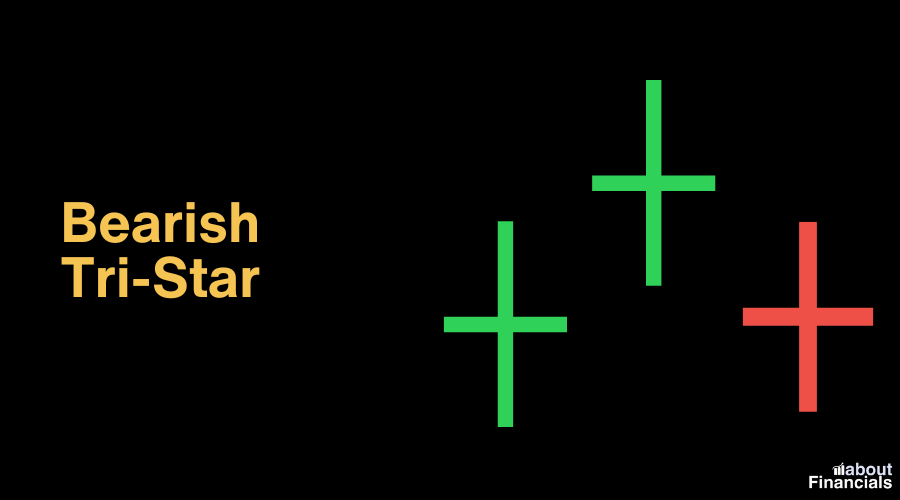
The bearish tri-star is a rare three-candle pattern characterized by three consecutive doji or small candles. It suggests extreme indecision in the market and often occurs at the end of a prolonged uptrend. While less common, the bearish tri-star can signal a potential reversal, especially when combined with other technical indicators and analysis.
Use: When identifying extreme indecision after a prolonged uptrend, the three consecutive doji or small candles indicate potential reversal. Use cautiously and look for additional confirming signals.
Avoid: When the pattern occurs without strong previous trends or in markets with erratic price movements.
8. Three Black Crows

The three black crows pattern is a strong bearish reversal signal. It comprises three consecutive long bearish candles, each opening within the body of the previous candle and closing lower. This pattern indicates a rapid shift from an uptrend to a downtrend, with sellers dominating the market and potentially leading to further downward movement.
Use: In established uptrends, the consecutive long bearish candles suggest sustained selling pressure and potential trend reversal. Combine with trend analysis and volume confirmation.
Avoid: In sideways markets or when there is a lack of confirmation from other technical indicators.
9. Bearish Meeting Lines
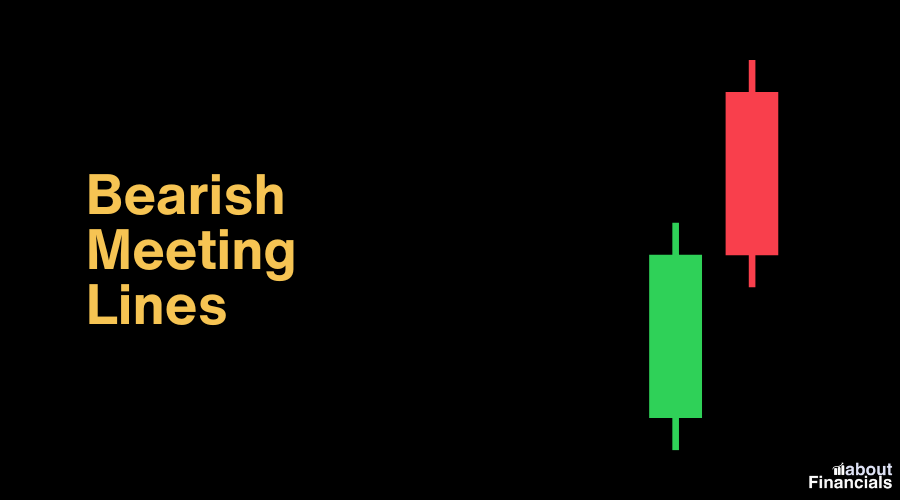
The bearish meeting lines pattern consists of two candles. It starts with a bullish candle followed by a bearish candle. The second bearish candle opens at or near the close of the previous bullish candle and closes lower. This pattern suggests a potential reversal from an uptrend to a downtrend as selling pressure starts to outweigh buying pressure.
Use: After a strong uptrend, the bearish meeting lines pattern indicates potential weakening of bullish momentum and a shift in sentiment. Look for confirmation in subsequent sessions.
Avoid: In markets with low volatility where small price ranges may not accurately reflect changing sentiment.
10. Bearish Squeeze Alert
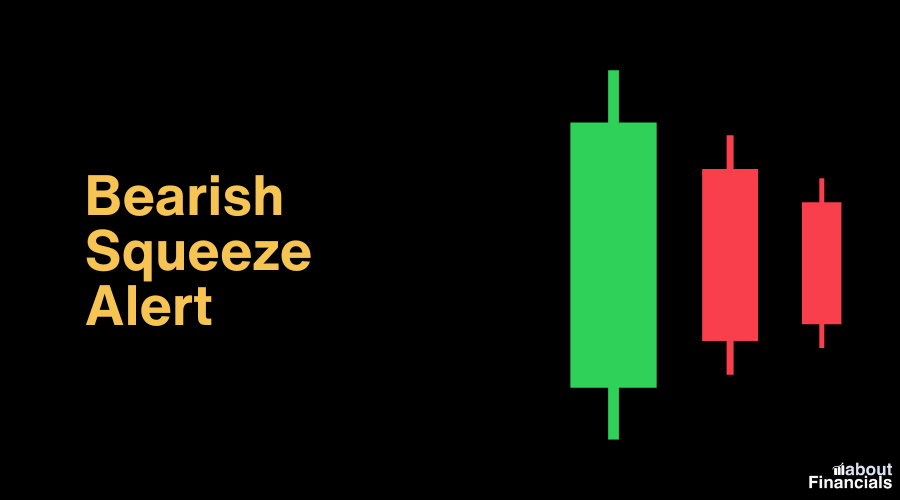
The bearish squeeze alert pattern is a two-candle formation that warns of a potential reversal in an uptrend. It involves a small bullish candle followed by a bearish marubozu candle. The bearish candle engulfs the previous candle’s body, indicating a possible shift in momentum and a potential trend reversal.
Use: In overbought markets, the bearish squeeze alert pattern signals potential trend reversal. The bearish marubozu engulfs the previous candle’s body, indicating increased selling pressure.
Avoid: In trending markets where the bullish candle preceding the pattern is exceptionally strong, as the reversal might not materialize.
11. Bearish Harami
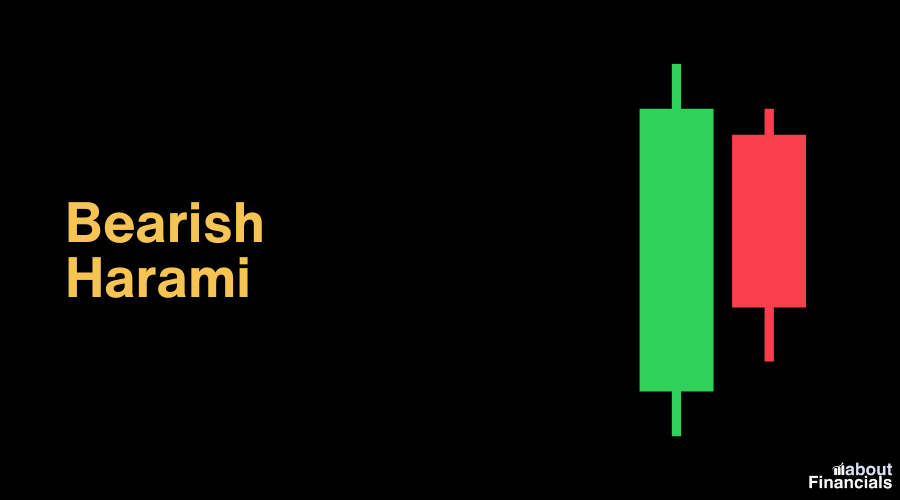
The bearish harami pattern is a two-candle formation. It starts with a larger bullish candle followed by a smaller bearish candle that is entirely engulfed within the previous candle’s body. This pattern suggests a weakening of the previous bullish momentum and a possible upcoming reversal.
Use: In uptrends, the bearish harami pattern suggests a potential weakening of bullish momentum. The smaller bearish candle inside the larger bullish one indicates a possible shift in sentiment.
Avoid: In volatile markets or when the bullish candle is disproportionately large, as this may affect the pattern’s accuracy.
12. Bearish Three Inside Down
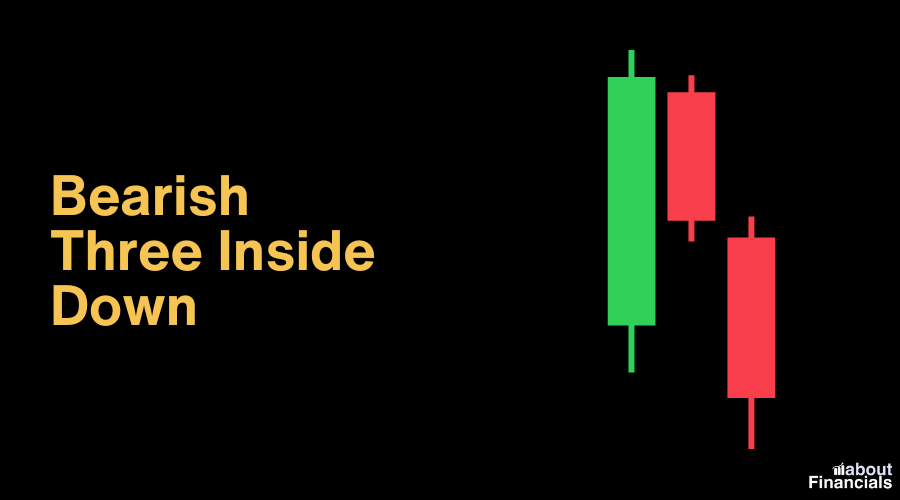
The bearish three inside down pattern involves three candles. It begins with a bullish candle followed by a smaller bearish candle that is engulfed by the larger bearish candle that follows. This pattern indicates a potential reversal as the bears gain control and begin to push the price downward.
Use: After an uptrend, the bearish three inside down pattern highlights potential reversal. The larger bearish candle engulfs the smaller one, confirming the shift in sentiment.
Avoid: In markets with narrow price ranges or when the pattern lacks confirmation from other technical tools.
13. Bearish Side-by-Side White Lines
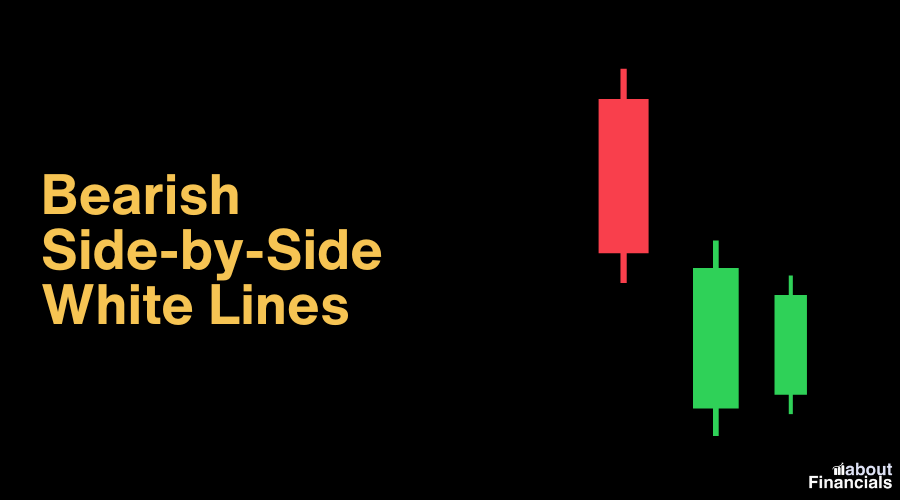
The bearish side-by-side white lines pattern consists of two consecutive bullish candles. However, the second candle opens at or near the close of the previous candle and closes lower. This pattern suggests a potential weakening of the bullish trend and a possible reversal.
Use: In overbought markets, the bearish side-by-side white lines pattern suggests potential trend reversal. The second candle opening at/near the first candle’s close indicates weakening bullish sentiment.
Avoid: In trending markets where small gaps are common, as the pattern’s significance might be diminished.
14. Bearish Gravestone Doji
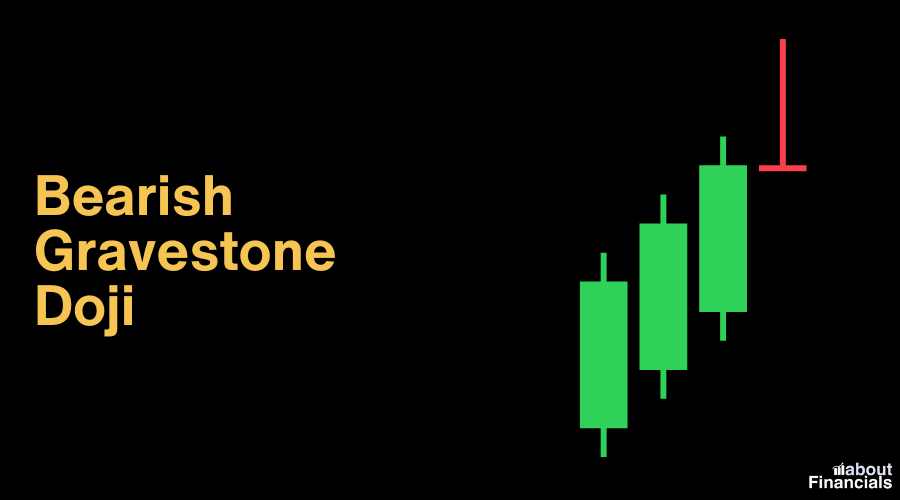
The bearish gravestone doji is a single candlestick pattern characterized by a long upper shadow and no lower shadow, creating the appearance of an inverted “T.” This pattern suggests that sellers have gained control, and it often occurs at the end of an uptrend, signaling a potential reversal.
Use: At the end of uptrends, the bearish gravestone doji indicates potential reversal. The long upper shadow suggests that buyers lost control, and the price may decline.
Avoid: In markets with erratic price movements or when the pattern appears without a clear trend.
15. Evening Doji Star
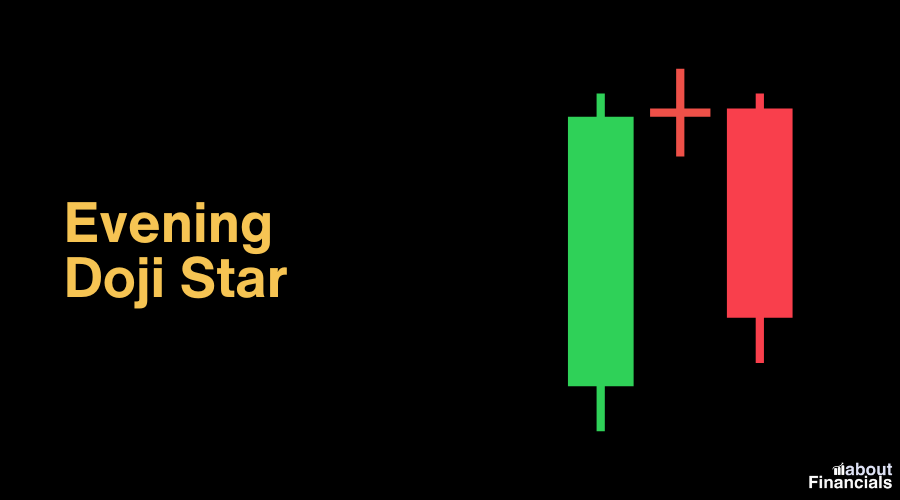
The evening doji star is a three-candle pattern that includes a bullish candle, followed by a doji, and then a bearish candle. The doji indicates indecision, and the bearish candle confirms the potential reversal. This pattern suggests that the uptrend may be losing steam and a bearish reversal could be imminent.
Use: After an uptrend, the evening doji star signals potential reversal. The doji indicates indecision, and the bearish candle confirms the shift in sentiment.
Avoid: In markets with low liquidity or when the pattern lacks confirmation.
16. Bearish Counterattack
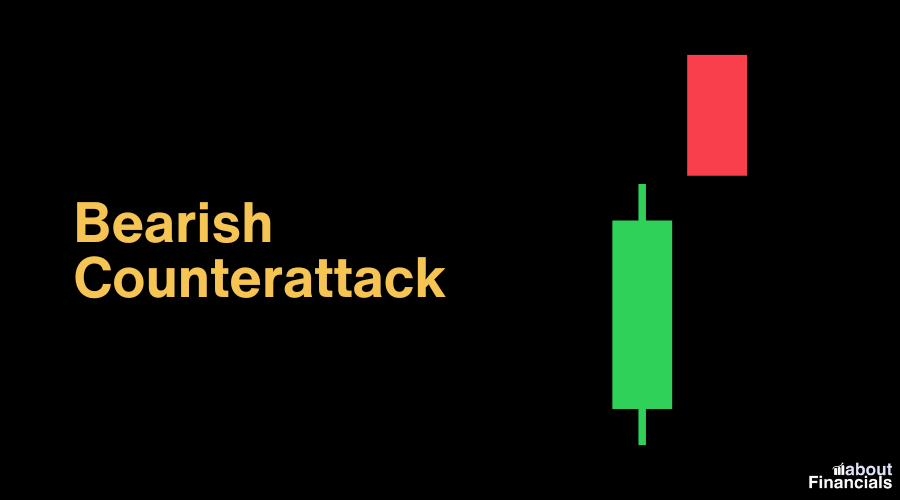
The bearish counterattack pattern involves two candles. It starts with a bullish candle followed by a larger bearish candle that closes below the open of the previous bullish candle. This pattern suggests a reversal of the previous bullish momentum and a potential shift towards a downtrend.
Use: In overbought markets, the bearish counterattack pattern suggests a potential reversal. The larger bearish candle closing below the bullish open indicates a shift in momentum.
Avoid: In strong downtrends or when the bullish candle is exceptionally significant.
17. Bearish Ladder Bottom
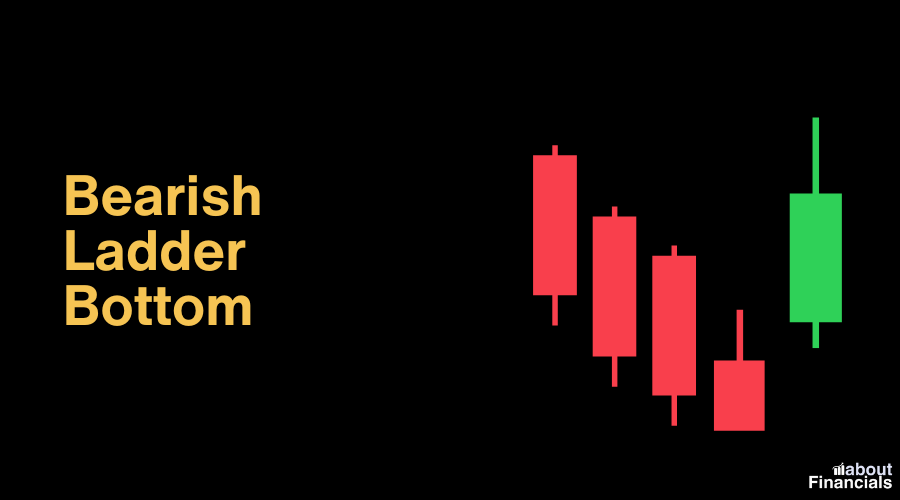
The bearish ladder bottom is a five-candle pattern characterized by a series of lower highs and lower lows. This pattern indicates increasing selling pressure and potential weakening of the bullish trend. It can serve as a warning of a possible trend reversal.
Use: As a warning of potential trend reversals, the bearish ladder bottom pattern suggests increasing selling pressure. Monitor for confirmation from other technical indicators.
Avoid: In trending markets where the pattern lacks confirmation or when the price is highly volatile.
18. Bearish Two Crows

The bearish two crows pattern consists of three candles. It starts with two small bullish candles followed by a larger bearish candle. This pattern suggests that buyers are losing control, and the bears are gaining strength, potentially leading to a reversal of the current trend.
Use: In strong uptrends, the bearish two crows pattern indicates potential reversal. The bearish candle following two small bullish ones suggests a shift in market sentiment.
Avoid: In markets where the bullish candles are too small to effectively signal a reversal.
19. Shooting Star

The shooting star is a single candlestick pattern characterized by a small real body, a long upper shadow, and little to no lower shadow. It typically appears after an uptrend and signals potential exhaustion and reversal. The long upper shadow indicates that sellers pushed the price significantly lower during the session, suggesting a potential shift in sentiment.
Use: In overbought conditions, the shooting star suggests potential reversal. The long upper shadow and small real body indicate sellers pushing prices lower.
Avoid: In markets with significant gaps or when the pattern lacks confirmation.
20. Hanging Man

The hanging man is similar to the shooting star but occurs after an uptrend. It has a small real body, a long lower shadow, and little to no upper shadow. This pattern indicates potential weakness in the uptrend and a possible reversal. It’s important to confirm the reversal with additional price action.
Use: To anticipate potential reversals after uptrends, the hanging man pattern suggests sellers gaining momentum. Confirm with other technical tools.
Avoid: When the pattern lacks confirmation or occurs without a clear trend.
21. Bearish Marubozu

The bearish Marubozu is a single candlestick pattern with a long black or red body and little to no shadows. It suggests strong selling pressure throughout the entire session, with the price closing near the low. This pattern indicates a bearish sentiment and can signal a potential trend continuation or reversal.
Use: To identify strong bearish sentiment and potential reversals, the bearish marubozu suggests continued selling pressure.
Avoid: In markets with low volatility or when the pattern occurs without a preceding trend.
Bearish candlestick patterns cheat sheet
We are excited to present you with a complimentary resource that can significantly enhance your trading acumen – the “Bearish Candlestick Patterns Cheat Sheet” in PDF format. This comprehensive guide is tailored to empower traders of all levels with a basic understanding of bearish candlestick patterns. We believe that by providing you with this valuable resource, we are contributing to your journey towards becoming a more confident and proficient trader. Download your free Bearish Candlestick Patterns Cheat Sheet in PDF and unlock the potential to navigate the complexities of the financial markets with greater precision and insight.
Final thoughts
In the fast-paced trading of financial products, having a reliable guide can be the difference between success and uncertainty. The Bearish Candlestick Patterns Cheat Sheet arms traders with a concise yet insightful overview of essential bearish candlestick patterns. By recognizing these patterns and understanding where to apply them, traders can gain a valuable edge in identifying potential trend reversals and making strategic moves.