
In this article, we will share with you the ultimate Bullish Candlestick Patterns Cheat Sheet.
Candlestick patterns are powerful tools in the world of technical analysis, providing traders and investors with valuable insights into potential price movements.
Bullish candlestick patterns, in particular, indicate a shift from bearish sentiment to bullish momentum, suggesting that an asset’s price may be poised for an upward move.
When a bullish candlestick pattern forms, it signifies that buyers are gaining control and pushing prices higher. This shift in balance can be a precursor to bullish price movement, making these patterns essential tools for identifying potential trading opportunities.
Importance of Identifying Bullish Signals
The ability to recognize and interpret bullish candlestick patterns is a valuable skill for traders and investors. By understanding these patterns, market participants can:
- Anticipate potential trend reversals
- Enhance entry and exit strategies
- Confirm trading decisions
- Manage risk
Essential Bullish Candlestick Patterns
In this section, we will delve into the essential bullish candlestick patterns that traders often encounter across different markets. Understanding the characteristics and implications of these patterns can provide valuable insights into potential price movements and aid in making informed trading decisions.
1. Hammer
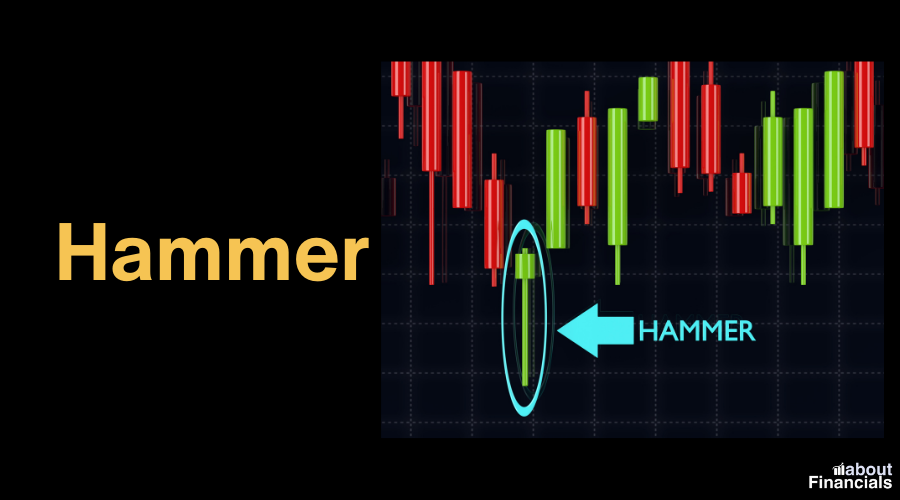
The Hammer is a single candlestick pattern characterized by a small body located at the upper end of the trading range and a long lower shadow.
This pattern suggests that despite significant selling pressure during the trading session, buyers managed to push the price back up by the session’s close.
The Hammer is considered a bullish reversal pattern and can be a sign of potential trend reversal from bearish to bullish.
Opportunity: Look for a Hammer after a prolonged downtrend. It signifies that sellers pushed prices significantly lower during the session but couldn’t sustain it, leading to a potential reversal. The long lower shadow shows buyers stepping in at those lower levels, indicating a shift in sentiment.
Threat: Avoid relying solely on a Hammer in sideways markets or when the pattern lacks confirmation from other indicators. In such cases, the pattern may not carry enough weight for a reliable trade.
2. Inverted Hammer

Similar to the Hammer, the Inverted Hammer features a small body at the lower end of the trading range and a long upper shadow. It indicates that buyers made a strong comeback after an initial downtrend, suggesting a potential reversal. The Inverted Hammer is often seen as a bullish signal, especially when it appears after a sustained downtrend.
Opportunity: Consider an Inverted Hammer after a downtrend. It suggests that despite selling pressure, buyers managed to push prices higher, indicating a possible reversal. It’s especially valuable if it appears near support levels.
Threat: Avoid using an Inverted Hammer in strongly established uptrends, as it might indicate a mere temporary pause rather than a true reversal. Also, if other bearish signals are present, the Inverted Hammer’s impact could be diminished.
3. Bullish Engulfing
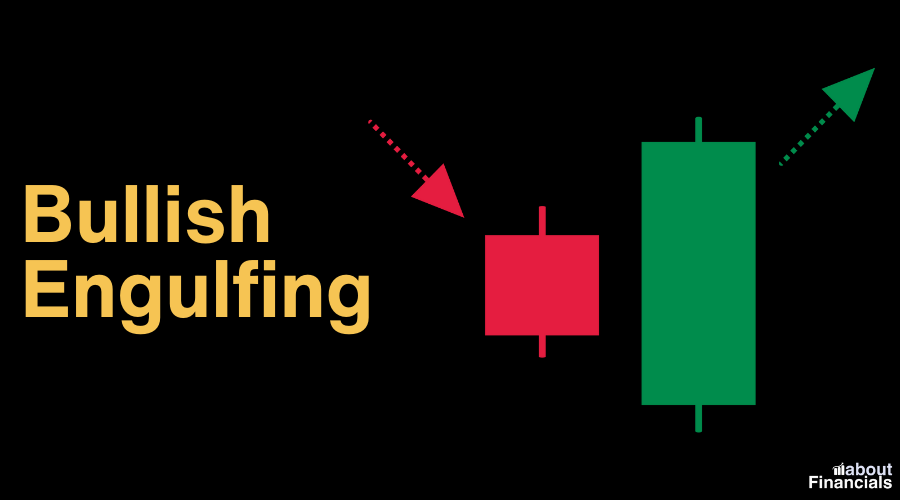
The Bullish Engulfing pattern consists of two candlesticks: a smaller bearish candlestick followed by a larger bullish candlestick that completely engulfs the previous candle’s body. This pattern suggests a shift from bearish to bullish sentiment, as buyers overwhelm sellers, potentially leading to a price reversal or continuation of an uptrend.
Opportunity: Employ a Bullish Engulfing pattern when a large bullish candle fully engulfs the previous bearish candle. This suggests a strong shift from bearish to bullish sentiment, often signaling the end of a downtrend and potential upward momentum.
Threat: Be cautious when applying the Bullish Engulfing pattern in markets with low volatility or during periods of uncertainty, as false signals can occur. Confirm with other indicators for higher reliability.
4. Piercing Pattern
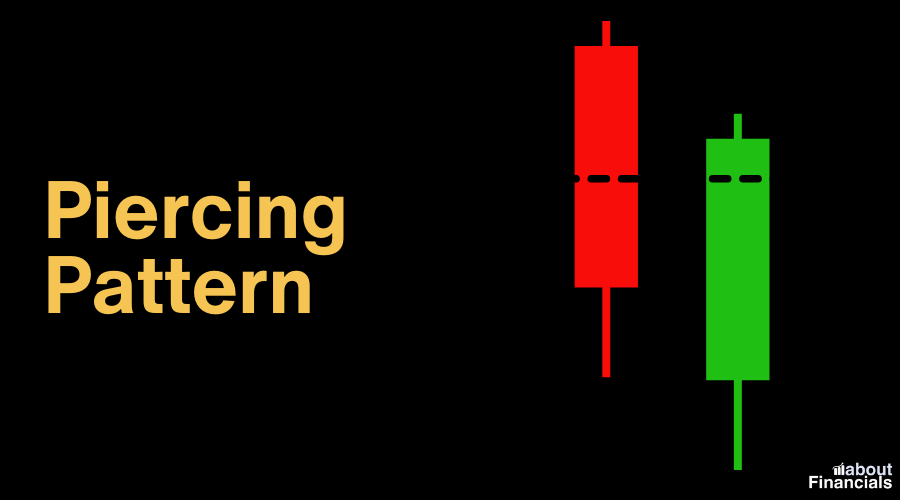
The Piercing Pattern is a two-candle bullish reversal pattern. It consists of a bearish candlestick followed by a bullish candlestick that opens below the previous close and closes above the midpoint of the previous candle’s body. This pattern indicates a potential reversal, as buyers step in to push prices higher after an initial downtrend.
Opportunity: Look for a Piercing Pattern when a bullish candle opens lower than the previous day’s bearish candle but closes above its midpoint. This can indicate a potential reversal as buyers overpower sellers.
Threat: Avoid the Piercing Pattern in markets where the bullish candle does not fully penetrate the previous day’s bearish candle, as this weakens its bullish signal. Additionally, ensure that other technical indicators align for confirmation.
5. Morning Star

The Morning Star is a three-candle pattern that signifies a potential trend reversal. It begins with a bearish candlestick, followed by a small-bodied candle (either bullish or bearish), and concludes with a larger bullish candlestick. The Morning Star suggests that sellers are losing control, and buyers may be taking charge, potentially leading to a bullish move.
Opportunity: Employ the Morning Star when it appears after a downtrend. It consists of a bearish candle, a small-bodied candle (doji or spinning top), and a large bullish candle. This suggests a potential reversal, as buyers regain control and sellers weaken.
Threat: Avoid relying solely on the Morning Star in strong uptrends, as it might indicate a temporary pause rather than a full reversal. Confirm with trend analysis and other indicators.
6. Three White Soldiers

The Three White Soldiers pattern is a strong bullish reversal pattern consisting of three consecutive bullish candlesticks with increasing closing prices. This pattern indicates a powerful shift in momentum from bearish to bullish and often precedes significant upward price movement.
Opportunity: Consider the Three White Soldiers pattern after a prolonged downtrend. It involves three consecutive bullish candles with higher closes, signaling a strong reversal and shift to bullish momentum.
Threat: Avoid using the Three White Soldiers in overbought conditions or when other indicators suggest an impending correction. A potential trend reversal should be confirmed with additional analysis.
7. Three Inside Up

The Three Inside Up is a three-candle bullish reversal pattern. It starts with a bearish candlestick followed by a smaller bullish candlestick that is completely engulfed by the third larger bullish candlestick. This pattern suggests that buyers are gaining strength and may drive prices higher.
Opportunity: Employ the Three Inside Up pattern after a downtrend. The smaller bearish candle is engulfed by a larger bullish one, indicating a potential reversal and buyer strength.
Threat: Avoid relying solely on the Three Inside Up pattern without confirming indicators, especially in markets with low volatility or unclear trends.
8. Three Outside Up

Similar to the Three Inside Up, the Three Outside Up pattern consists of three candles. It begins with a bearish candlestick, followed by two consecutive larger bullish candlesticks. The second bullish candlestick engulfs the body of the previous bearish candle, indicating a potential trend reversal.
Opportunity: Look for the Three Outside Up pattern after a downtrend. The second bullish candle engulfs the body of the previous bearish candle, suggesting a potential bullish reversal.
Threat: Avoid using the Three Outside Up in strongly bearish markets or if other indicators conflict with the pattern’s signal.
9. Bullish Harami
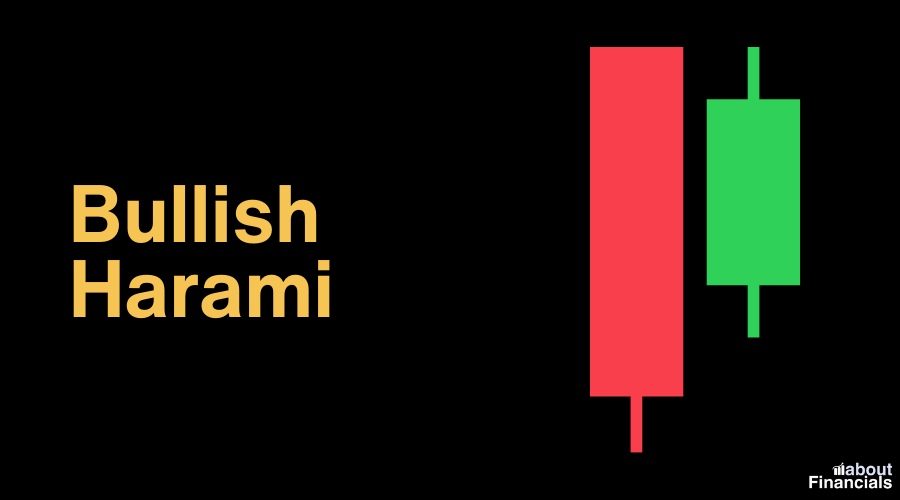
The Bullish Harami is a two-candle pattern where a small bullish candlestick is contained within the previous larger bearish candle’s body. This pattern suggests a potential reversal, as buyers begin to counteract the previous bearish sentiment.
Opportunity: Consider the Bullish Harami after a downtrend. It involves a small bullish candle within the larger body of a preceding bearish candle, indicating a potential reversal.
Threat: Avoid relying solely on the Bullish Harami in choppy markets or without confirmation from other technical tools.
10. Bullish Harami Cross

The Bullish Harami Cross is similar to the Bullish Harami but features a doji (candle with almost equal open and close) as the second candle. This pattern indicates uncertainty in the market, potentially leading to a bullish reversal after a downtrend.
Opportunity: Look for a Bullish Harami Cross after a downtrend, especially when the doji is at the bottom of the trend. It implies potential buyer strength and a reversal.
Threat: Avoid using the Bullish Harami Cross without confirming signals, as the doji alone might not be sufficient to predict a reversal.
11. Rising Three Methods

The Rising Three Methods is a continuation pattern that involves a long bullish candlestick followed by three smaller bearish candlesticks. The fifth candle is a larger bullish candlestick that engulfs the previous bearish candles. This pattern suggests a brief consolidation before the prevailing uptrend resumes.
Opportunity: Apply the Rising Three Methods after a strong uptrend. The pattern involves a long bullish candle followed by smaller bearish ones and a final large bullish candle. It suggests brief consolidation before the uptrend resumes.
Threat: Avoid using the Rising Three Methods in markets without a clear trend or if other indicators point to a reversal.
12. Bullish Abandoned Baby
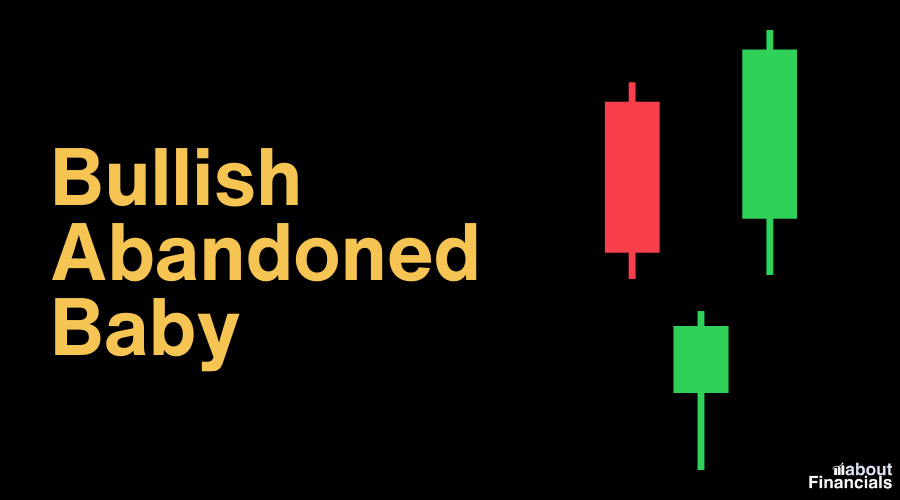
The Bullish Abandoned Baby is a rare three-candle pattern that often signals a major reversal. It consists of a doji, a gap, and a bullish candlestick. The gap indicates a sudden shift in sentiment, and the pattern suggests a potential bullish reversal after a downtrend.
Opportunity: Consider the Bullish Abandoned Baby after a downtrend. It comprises a doji, gap, and bullish candle sequence, suggesting a sudden shift in sentiment and potential trend reversal.
Threat: Avoid using the Bullish Abandoned Baby without confirming signals, as gaps can be influenced by other factors and might not always lead to a reversal.
Advanced bullish candlestick patterns
Building upon the foundational knowledge of essential bullish candlestick patterns, let’s explore some more advanced patterns that can provide traders with deeper insights into market dynamics and potential price movements.
13. Bullish Kicker
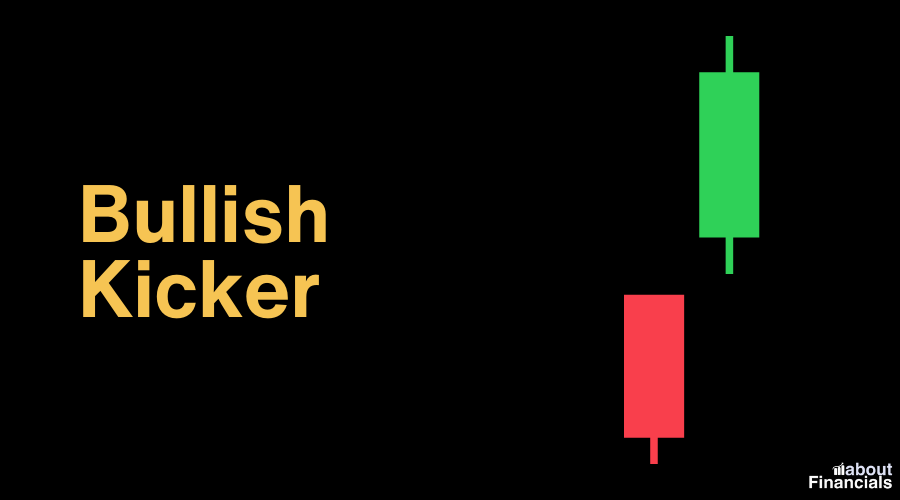
The Bullish Kicker is a two-candle pattern characterized by a sudden and decisive shift from a downtrend to a strong uptrend. It involves a bearish candlestick followed by a larger bullish candlestick that completely engulfs the previous candle. This pattern indicates a rapid change in sentiment, often triggered by significant news or events.
Opportunity: Apply the Bullish Kicker pattern after a downtrend. It involves a bearish candle followed by a larger bullish one, indicating a swift shift in sentiment and potential reversal.
Threat: Avoid using the Bullish Kicker without confirming indicators, especially in choppy markets where the pattern’s signal might be less reliable.
14. Bullish Marubozu
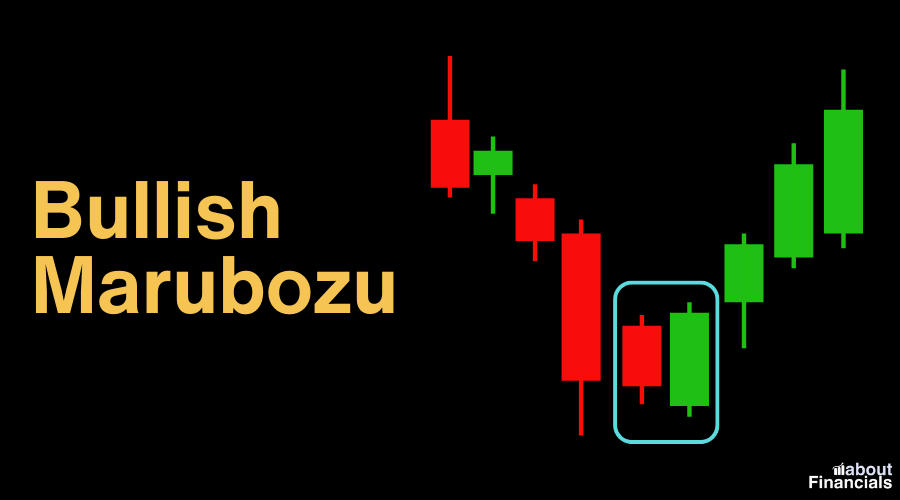
The Bullish Marubozu is characterized by a long bullish candlestick with little to no wicks or shadows. It indicates strong buying pressure from the opening price to the closing price, suggesting a continuation of the bullish trend.
Opportunity: Consider the Bullish Marubozu pattern in well-defined uptrends. It’s characterized by a long bullish candle with minimal or no wicks, indicating strong buying pressure and potential continuation.
Threat: Avoid relying solely on the Bullish Marubozu in sideways markets or during periods of uncertainty, as its signal might be less reliable without confirmation.
15. Tweezer Bottoms

Tweezer Bottoms consist of two candlesticks with matching lows, signaling potential support and a reversal from a downtrend. The first candlestick is bearish, followed by a bullish candlestick that tests the same low. This pattern indicates a potential change in market sentiment and a potential price rebound.
Opportunity: Employ the Tweezer Bottoms pattern after a downtrend. When two candlesticks share the same low, it suggests potential buyer strength and a reversal.
Threat: Avoid using Tweezer Bottoms without confirming indicators, especially in markets with low volatility or when other signals contradict the pattern’s suggestion.
16. Concealing Baby Swallow
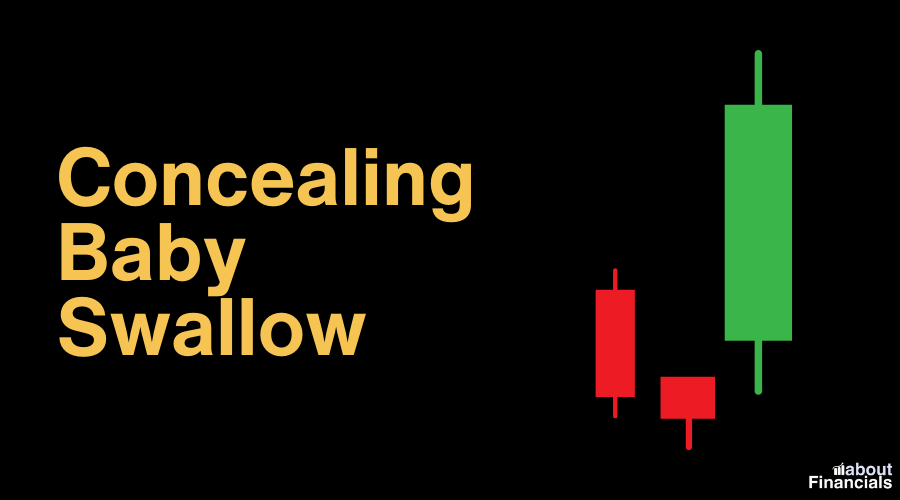
The Concealing Baby Swallow is a two-candle bullish continuation pattern that occurs during an uptrend. It involves a series of small-bodied candlesticks followed by a larger bullish candlestick that engulfs the previous candles. This pattern suggests a brief consolidation before the prevailing uptrend resumes.
Opportunity: Consider the Concealing Baby Swallow pattern within an established uptrend. It involves a series of small candles followed by a larger bullish one, suggesting brief consolidation before continuation.
Threat: Avoid using the Concealing Baby Swallow without confirming signals or in markets with strong volatility that might impact the pattern’s reliability.
17. Ladder Bottom
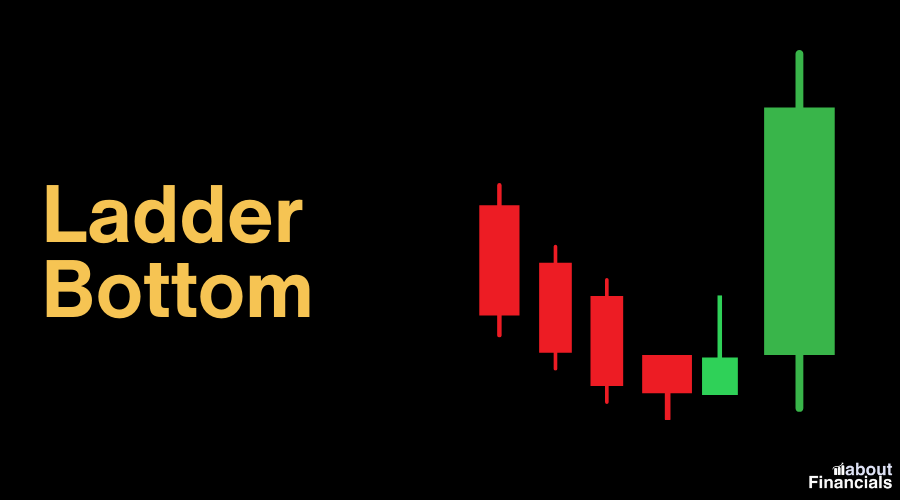
The Ladder Bottom is a bullish reversal pattern that consists of five consecutive small-bodied candlesticks, followed by a larger bullish candlestick. This pattern suggests a gradual accumulation of buying pressure and potential trend reversal.
Opportunity: Apply the Ladder Bottom pattern after a downtrend. It consists of five small-bodied candles followed by a larger bullish one, indicating gradual accumulation of buying pressure and potential reversal.
Threat: Avoid using the Ladder Bottom without confirming signals, as the pattern’s signal might be less reliable in volatile markets or when other indicators conflict.
18. Dragonfly Doji
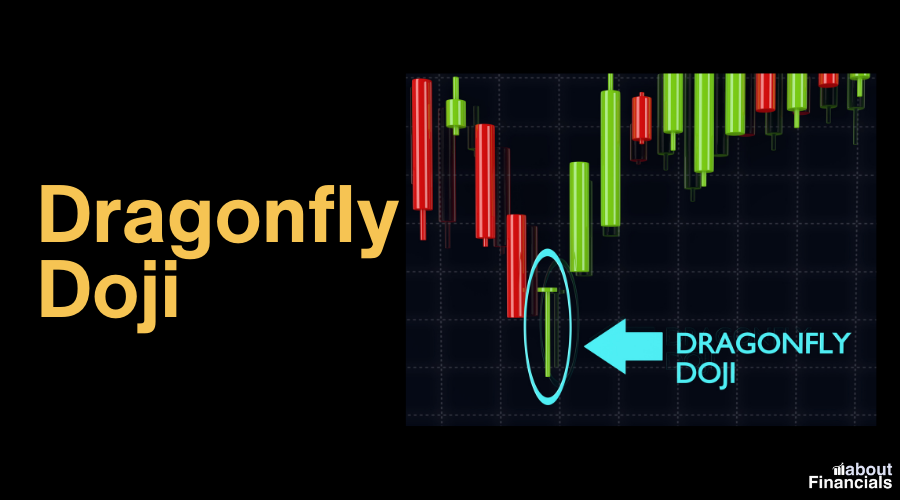
The Dragonfly Doji is characterized by a doji candlestick with a long lower shadow and little to no upper shadow. It suggests a potential bullish reversal after a downtrend, as buyers regain control and push prices higher.
Opportunity: Consider the Dragonfly Doji after a downtrend. With a long lower shadow and minimal upper shadow, it suggests buyers overcoming selling pressure and potential reversal.
Threat: Avoid relying solely on the Dragonfly Doji in choppy markets or without confirming indicators, as other factors can influence price action.
Applying bullish candlestick patterns
Now that we have explored a wide range of bullish candlestick patterns, it’s time to discuss how to effectively apply this knowledge to your trading strategies. Integrating these patterns into your analysis can enhance your decision-making process and potentially lead to more successful trading outcomes.
Tips for Effective Application
Confirmation with Volume
While candlestick patterns provide valuable insights, confirming their signals with trading volume can enhance their reliability. A surge in trading volume during the formation of a bullish pattern can validate the potential price reversal or continuation.
Timeframes
Consider analyzing candlestick patterns across different timeframes, from short-term intraday charts to longer-term daily or weekly charts. Patterns that align across multiple timeframes may carry stronger predictive power.
Pattern Combinations
Combining multiple bullish patterns or integrating them with other technical indicators can provide stronger confirmation signals. For instance, a Bullish Engulfing pattern appearing near a key support level and accompanied by a bullish divergence in an oscillator could reinforce a potential bullish move.
Integrating bullish candlestick patterns with indicators
Moving Averages: Combine bullish candlestick patterns with moving averages to identify potential trend reversals or confirm an existing uptrend.
RSI and Stochastic Oscillator: Use overbought or oversold conditions in conjunction with bullish candlestick patterns to anticipate price rebounds.
Fibonacci Retracements: Incorporate Fibonacci retracement levels to identify potential price targets following a bullish reversal pattern.
Bullish Candlestick Patterns Cheat Sheet
Ready to elevate your trading game? Access our complimentary Bullish Candlestick Patterns Cheat Sheet PDF and equip yourself with the tools to make confident trading decisions. Download your copy now and start harnessing the power of these patterns to unlock potential profits. To download your free copy, simply click here. No sign up required.
Final thoughts
Bullish candlestick patterns offer valuable insights into market sentiment and potential price movements. By mastering the recognition and interpretation of these patterns and integrating them with other technical indicators, you can develop a strong trading edge. Remember that while these patterns can provide high-probability signals, risk management remains crucial. Continuously refine your skills through practice, observation, and analysis to make well-informed trading decisions that align with your overall trading strategy.
As we conclude our journey through the Bullish Candlestick Patterns Cheat Sheet, you have armed yourself with invaluable knowledge that can reshape your trading success. By recognizing these patterns and integrating them into your strategies, you’re better equipped to spot opportunities, manage risks, and achieve your financial goals. Stay vigilant, keep learning, and let this cheat sheet be your guiding light to prosperous trading ventures.