
Candlestick charts provide a vivid depiction of price action, offering traders a concise yet comprehensive way to analyze market behavior.
In this article, we will explore one of the notable reversal patterns, i.e., the Bearish Engulfing Pattern.
Exploring the bearish engulfing pattern
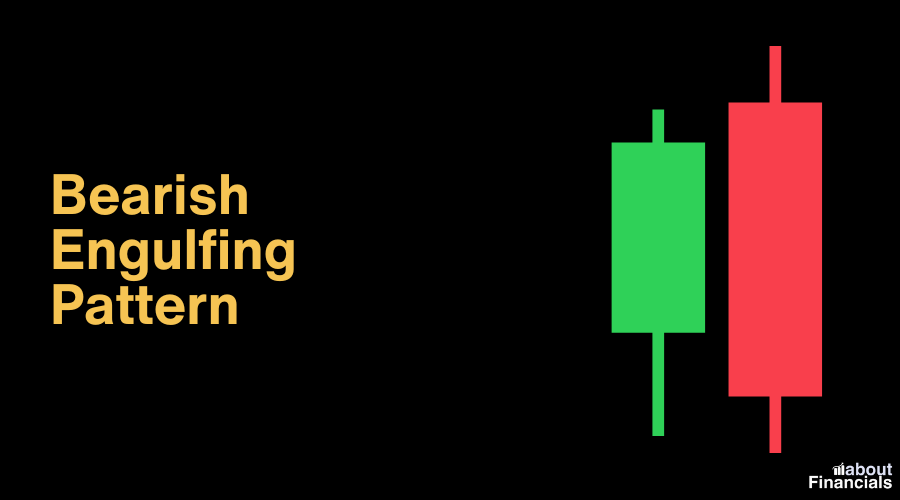
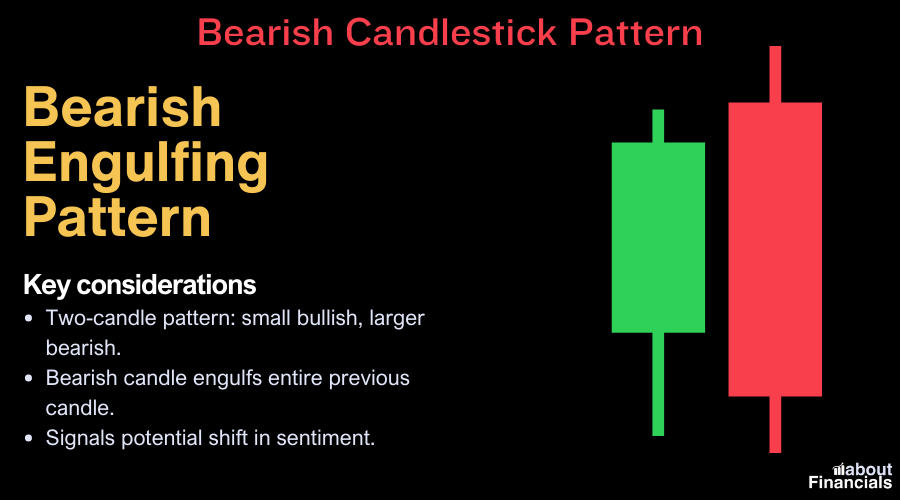
The Bearish Engulfing Pattern is a powerful candlestick pattern that stands as a potential harbinger of a bearish reversal in the market. It is characterized by its distinct formation, where a smaller bullish candle is completely engulfed by a larger bearish candle in the subsequent time frame. This pattern signals a shift in market sentiment from bullishness to bearishness and can serve as a valuable tool for traders looking to capitalize on impending downtrends.
Characteristics of the bearish engulfing pattern
To recognize the Bearish Engulfing Pattern, pay close attention to the following attributes:
Size difference
The bearish candle that engulfs the preceding bullish candle should be noticeably larger in size, indicating a strong surge in selling pressure.
Color reversal
The bullish candle is typically colored green or white, while the engulfing bearish candle is red or black. This visual shift reflects the transition from positive to negative sentiment.
Complete engulfment
The bearish candle’s body should completely engulf the body of the preceding bullish candle, covering its entire range.
Significance of the pattern
The Bearish Engulfing Pattern holds significance due to its representation of a swift shift in market dynamics. It suggests that the bears have gained the upper hand, overpowering the bulls, and potentially foreshadowing a forthcoming downtrend. Traders often interpret this pattern as a signal to consider short positions or tighten stop-loss orders to protect existing long positions.
Identifying bearish engulfing patterns
Recognizing the Bearish Engulfing Pattern amidst the myriad of price movements is a skill that can greatly enhance your trading acumen. Here is a step-by-step guide to identifying this pattern on a price chart:
Select a suitable time frame
Begin by choosing an appropriate time frame for your analysis. The Bearish Engulfing Pattern can manifest across various time frames, from minutes to weeks. Consider the trading style you employ and select a time frame that aligns with your strategy.
Observe recent price action
Scan the price chart to locate a recent bullish candle, characterized by a smaller body indicating a price increase.
Look for the engulfing candle
Identify the subsequent bearish candle that engulfs the bullish candle. The bearish candle should have a larger body and cover the entire range of the previous bullish candle.
Confirm color change
Ensure that the color of the bearish candle is in direct contrast to the color of the engulfed bullish candle. This shift in color reflects the shift in market sentiment.
Validate with volume
While not an inherent characteristic of the pattern, confirming the pattern’s appearance with an increase in trading volume can enhance its reliability.
Tips for effective spotting
- Keep an eye on significant support and resistance levels. A Bearish Engulfing Pattern occurring near a resistance level or after a prolonged uptrend can carry greater weight.
- Practice identifying the pattern on historical charts to sharpen your recognition skills.
Interpreting the bearish engulfing pattern
Bearish Engulfing Pattern represents a clear shift in market sentiment, reflecting the tug-of-war between buyers and sellers.
The Bearish Engulfing Pattern signifies a decisive shift in market sentiment. The initial bullish candle reflects a period of buying interest and optimism. However, the subsequent bearish candle engulfs the bullish candle, indicating that bears have gained control and are now dominating the market.
The pattern often emerges after a sustained uptrend, signaling potential exhaustion of the bullish momentum. As bulls struggle to push prices higher, bears step in with forceful selling, leading to the engulfing formation.
Monitoring trading volume can provide valuable confirmation of the pattern’s validity. A substantial increase in volume during the engulfing candle’s formation suggests heightened conviction among market participants, lending more weight to the potential bearish reversal.
Moreover, traders who recognize the Bearish Engulfing Pattern may interpret it as an opportunity to initiate short positions or consider liquidating long positions. However, it’s crucial to remember that no single pattern guarantees a certain outcome. Proper risk management, thorough analysis, and consideration of other indicators are essential.
Trading strategies using the bearish engulfing pattern
Depending on your trading style and risk tolerance, you can leverage this pattern in various ways:
Short positions
One of the most direct applications of the Bearish Engulfing Pattern is initiating short positions. When you spot a Bearish Engulfing Pattern after a prolonged uptrend, it suggests a potential shift from bullish to bearish sentiment.
Confirmation with indicators
Enhance the reliability of your trading decision by combining the Bearish Engulfing Pattern with technical indicators. For instance, if the pattern emerges near a significant resistance level and is accompanied by overbought signals from oscillators like the Relative Strength Index (RSI), it can reinforce your bearish bias.
Swing trading
Swing traders can utilize the Bearish Engulfing Pattern to identify entry points for short-term price swings. Look for patterns on higher time frames (such as daily or weekly) and align your trades with the prevailing trend for a higher probability of success.
Multiple Time Frame Analysis
Employ multiple time frame analysis to validate the pattern’s significance. If you spot a Bearish Engulfing Pattern on a shorter time frame (e.g., hourly), check for confluence with bearish patterns or trends on higher time frames (e.g., 4-hourly or daily) for a more comprehensive view.
Please note that successful trading involves a combination of skill, experience, and risk management. While the Bearish Engulfing Pattern can provide valuable insights, it is not a guaranteed predictor of market movements. Always conduct thorough research, consider your risk tolerance, and use proper position sizing to protect your capital.
Limitations and false signals
Being aware of these limitations and understanding how to navigate them is crucial for making well-informed trading decisions:
- In strong bullish trends, isolated Bearish Engulfing Patterns may result in false signals, as the overall momentum may override the bearish reversal indicated by a single pattern.
- Volatile markets can produce whipsaw movements, where price rapidly moves up and down, triggering false signals.
- Relying solely on the Bearish Engulfing Pattern may lead to missed opportunities or premature entries. Combining the pattern with other technical indicators, such as trendlines, moving averages, or volume analysis, can provide stronger confirmation.
- The pattern’s reliability diminishes when the market is in a sideways or range-bound phase. In such conditions, price movements may lack clear direction, leading to potential false signals from the pattern.
- Not every Bearish Engulfing Pattern will result in a significant trend reversal. Sometimes, the pattern might indicate a minor retracement within an ongoing uptrend rather than a complete reversal.
To mitigate the impact of these limitations, traders can employ the following strategies:
- Wait for Confirmation
- Use Multiple Time Frames
- Consider Support and Resistance
- Practice Risk Management
Bearish Engulfing Candlestick pattern – FAQs
Is bearish engulfing reliable?
Yes, the bearish engulfing pattern is considered a reliable bearish reversal signal. However, its reliability increases when confirmed by other technical indicators and analyzed in the context of the broader market trend.
What is the probability of bearish engulfing?
The probability of a bearish engulfing pattern leading to a bearish reversal depends on various factors, including market context and confirmation from other indicators. It’s important to combine pattern recognition with thorough analysis.
What is bearish engulfing and bullish engulfing?
Bearish engulfing – a candlestick pattern where a larger bearish candle engulfs the previous smaller bullish candle, suggesting a potential bearish reversal.
Bullish engulfing – the opposite, where a larger bullish candle engulfs the preceding bearish candle, indicating a potential bullish reversal.
How accurate are engulfing candlestick?
Engulfing candlestick patterns can be accurate, but their effectiveness is enhanced when used in conjunction with other tools for confirmation. Overreliance solely on engulfing patterns may lead to false signals.
What is the last bearish engulfing?
The last bearish engulfing refers to the most recent occurrence of a bearish engulfing pattern on a price chart. It signifies a potential shift in market sentiment from bullish to bearish.
What is the timeframe for engulfing candles?
Engulfing candles can appear on various timeframes, from short-term intraday charts (e.g., 15 minutes) to longer-term daily or weekly charts. The choice of timeframe depends on your trading style and strategy.
What is the secret of the engulfing candle?
The “secret” of the engulfing candle lies in its potential to indicate a reversal in market sentiment. It’s not a guaranteed predictor but serves as a visual representation of a shift from bullish to bearish (or vice versa) sentiment.
What is the two candlestick strategy?
The two candlestick strategy involves analyzing the relationship between two consecutive candlesticks to determine potential market direction. Engulfing patterns are one example of a two-candlestick strategy.
What is the two candle theory?
The two candle theory is a concept in technical analysis that focuses on the interaction between two consecutive candlesticks. It encompasses various patterns, including engulfing patterns, harami patterns, and more, to provide insights into potential market reversals or continuations.
Candlestick patterns cheat sheet – free PDF
Dive into our comprehensive articles on Bearish candlestick patterns cheat sheet and Bullish candlestick patterns cheat sheet [free PDF cheat sheet included]. Discover how to recognize and utilize various bearish and bullish patterns to make informed trading decisions.
Final thoughts
By understanding Bearish engulfing pattern’s formation, interpreting its implications, and considering its limitations, traders can make more informed decisions in their pursuit of profits. Remember that trading involves both art and science – while the Bearish Engulfing Pattern provides a structured approach, experience and adaptability are equally crucial. Continuously refine your skills, stay abreast of market developments, and always approach trading with a well-rounded strategy.