
Candlestick patterns, with their intriguing shapes and patterns, have long been a favorite tool of technical analysts and traders alike. Among these patterns, the bullish hammer candlestick stands out as a reliable indicator of a potential trend reversal.
Introduction to the bullish hammer candlestick
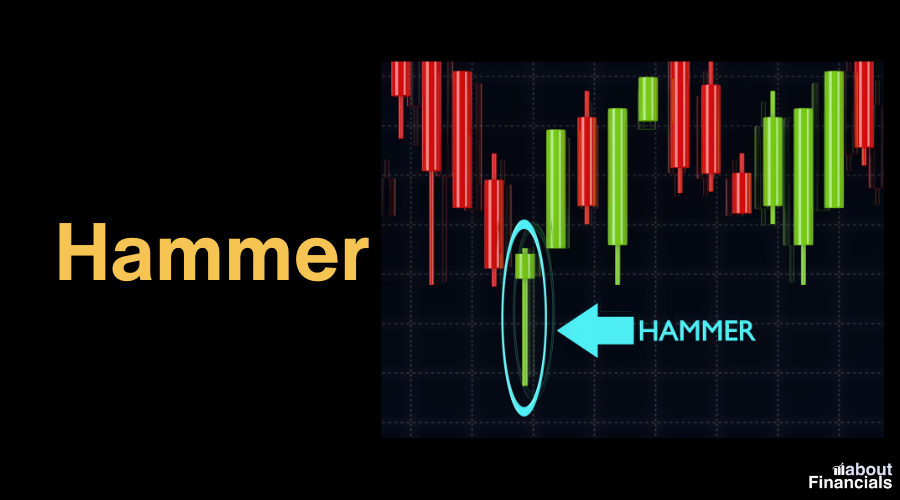
In this article, we will explroe the bullish hammer candlestick. This formation derives its name from its resemblance to a hammer, with a short body and a long lower shadow that resembles a handle. The bullish hammer is a potent signal that suggests a potential shift in market dynamics – a transition from a downtrend to a possible uptrend.
Characteristics of bullish hammer candlestick
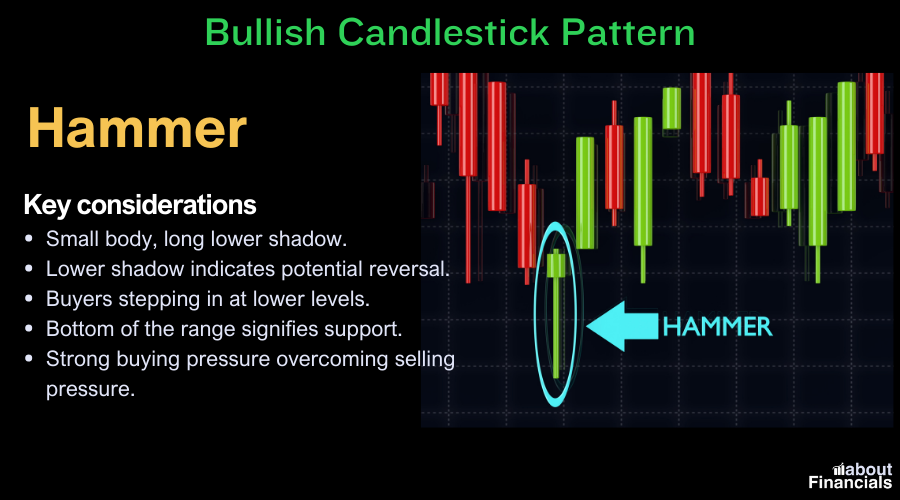
At its core, the bullish hammer candlestick is characterized by a relatively small real body (the difference between the open and close prices) and a long lower shadow, also known as the tail. This distinctive formation conveys a battle between buyers and sellers, ultimately resulting in a shift of momentum. The shorter body signifies that the opening and closing prices were relatively close, indicating indecision in the market.
The long lower shadow is a key element of the pattern. It represents a significant price rejection at the session’s lows, suggesting that sellers pushed the price down, but buyers managed to regain control and drive the price higher by the close. This dynamic showcases the potential for a bullish reversal, as buyers demonstrate their ability to counteract the prevailing selling pressure.
Anatomy of a bullish hammer
- Real Body and Shadow Lengths: The real body of the bullish hammer is typically small, often appearing as a narrow rectangle or a small candlestick. The length of the real body is less significant compared to the length of the shadow, particularly the lower shadow.
- Upper Shadow (Wick) and Lower Shadow (Tail): The upper shadow, if present, is usually short or nonexistent. The lower shadow, on the other hand, extends conspicuously beyond the real body. This elongated lower shadow, akin to a hammer’s handle, is a key feature that defines the pattern.
Differentiating the bullish hammer
Discerning the bullish hammer from other candlestick patterns is essential for accurate interpretation. One common mistake is confusing the bullish hammer with the inverted hammer. While both patterns share similarities, the inverted hammer has a small body and a long upper shadow, indicating potential exhaustion of buyers at the high point.
Interpretation and significance
Bullish reversal signal
Its appearance after a downtrend indicates that the balance of power between buyers and sellers may be shifting. The long lower shadow, which symbolizes the rejection of lower prices, suggests that buyers have stepped in to support the asset, potentially heralding an upward price movement.
When a bullish hammer emerges, it’s as if the market is sending a message of potential change – a message that the prevailing downtrend might be losing its momentum and giving way to a potential uptrend.
Psychological implications
As the price opens and declines significantly during the trading session, pessimism prevails, and sellers dominate the market. However, as the session progresses, buyers enter the scene with renewed vigor, driving the price higher and ultimately pushing the closing price closer to the opening price. This shift in sentiment reflects a potential reversal of fortunes and a transition from bearishness to optimism.
Furthermore, the long lower shadow indicates that buyers are not only countering the downward pressure but also pushing the price well above the day’s low. This showcases their determination and highlights the potential for a bullish surge in the subsequent sessions.
Identifying bullish hammer candlesticks
Utilizing candlestick charts
Candlestick charts visually represent price movements and patterns, making it easier to spot trends, reversals, and formations like the bullish hammer.
When analyzing candlestick charts, focus on individual candlesticks and their relationships with adjacent candles. Look for instances where the real body is small and located near the upper end of the candlestick’s range, while the lower shadow is noticeably longer. Such characteristics often indicate the formation of a bullish hammer.
Confirming with technical indicators
While the bullish hammer alone can provide valuable insights, combining it with technical indicators enhances its reliability. Oscillators like the Relative Strength Index (RSI) and the Moving Average Convergence Divergence (MACD) can offer confirmation of the pattern’s potential effectiveness.
For instance, if a bullish hammer forms near a significant support level and is accompanied by a bullish divergence on the RSI, the signal’s strength is further reinforced. Similarly, observing a bullish crossover on the MACD histogram alongside the formation of a bullish hammer could bolster the pattern’s credibility.
Practical tips for spotting bullish hammers
- Selecting the Right Timeframe: Different timeframes offer varying perspectives. While daily charts provide a broader view, shorter timeframes like hourly or 15-minute charts might offer more frequent opportunities to spot bullish hammer formations.
- Volume Analysis: Pay attention to trading volume when identifying a bullish hammer. A higher-than-average volume accompanying the pattern could signify stronger market conviction.
- Combining with Price Patterns: Consider combining the bullish hammer with other price patterns, such as trendlines, chart patterns, or Fibonacci retracement levels, to strengthen your analysis.
- Practice and Experience: Like any skill, recognizing bullish hammer patterns becomes more intuitive with practice. Regularly analyzing historical charts and real-time data will enhance your ability to spot these formations.
Trading and investment strategies
Entry and exit points
Mastering the art of timing entry and exit points based on the bullish hammer pattern is fundamental for successful trading and investing. Here’s a step-by-step approach to consider:
- Confirmation and Validation: Once you identify a potential bullish hammer, wait for confirmation in the form of a higher closing price in the subsequent session. This validates that buyers have indeed gained control.
- Entry Point: Consider entering a long position above the high of the bullish hammer candlestick or the high of the confirming candle. This ensures you participate in the potential bullish move.
- Stop-Loss Placement: Set a stop-loss order below the low of the bullish hammer or the confirming candle. This helps protect your capital in case the pattern fails to lead to the expected reversal.
Position sizing and risk management
Effective position sizing and risk management are critical aspects of trading success. Here’s how to integrate them with the bullish hammer pattern:
- Position Size: Calculate your position size based on your risk tolerance and the distance between your entry point and the stop-loss level. Never risk more than a predetermined percentage of your trading capital on a single trade.
- Risk-Reward Ratio: Aim for a favorable risk-reward ratio. For instance, if your stop-loss is 2% below your entry point, target a potential profit that is at least 4% above your entry.
- Diversification: Avoid overconcentration in a single asset. Diversifying your trades reduces the impact of a single trade’s failure on your overall portfolio.
Adapting to different instruments
The bullish hammer pattern is not confined to a specific market or asset class. Its principles can be applied to various financial instruments, such as stocks, forex pairs, and cryptocurrencies. However, remember that each market has its unique characteristics, so adapt your strategy accordingly.
While the bullish hammer pattern holds substantial potential, it’s important to acknowledge that not every instance will lead to a successful trade. Experience will teach you to distinguish between high-probability setups and false signals. Regularly reviewing your trades, noting your successes and failures, and adjusting your approach based on your observations is key to continuous improvement.
Common pitfalls and challenges
False signals and mitigation
While the bullish hammer pattern offers promising insights, it’s essential to acknowledge its limitations. Not every bullish hammer will result in a successful trade. False signals can occur due to market noise, sudden news events, or shifts in sentiment.
To mitigate the impact of false signals:
- Confirmation: Wait for confirming price action in the following sessions before entering a trade. A higher closing price or a bullish follow-through candle can provide stronger validation.
- Volume Analysis: Consider the trading volume accompanying the bullish hammer. Higher volume can indicate greater market conviction and increase the likelihood of a valid signal.
- Additional Indicators: Utilize other technical indicators or patterns to corroborate the bullish hammer’s signal, enhancing your confidence in the trade setup.
Market Conditions
Market conditions play a significant role in the efficacy of the bullish hammer pattern. In strongly trending markets, where momentum is firmly established, the bullish hammer might have a higher chance of success.
Bullish hammer pattern – FAQs
What is an example of a bullish hammer pattern?
An example of a bullish hammer pattern could occur in a stock’s price chart. Imagine a stock that has been experiencing a downtrend, characterized by declining prices. Suddenly, a candlestick forms with a small real body (the difference between open and close) near the top of the price range and a long lower shadow extending below the body. This pattern resembles a hammer, and it suggests that despite the initial selling pressure, buyers stepped in, potentially signaling a bullish reversal.
What happens after a bullish hammer?
After a bullish hammer forms, traders look for confirmation in subsequent price action. If the price continues to rise in the following sessions, it validates the bullish reversal signal provided by the hammer. Traders might consider entering long positions or adjusting their strategies based on this potential shift in sentiment.
What is the 3 candle rule?
The 3 candle rule is a guideline that suggests a bullish hammer should ideally be followed by at least three consecutive bullish (green) candles. This sequence reinforces the idea that buyers have taken control after the bullish hammer, increasing the pattern’s reliability as a bullish reversal signal.
Is a hammer always bullish?
No, a hammer is not always bullish. While a classic hammer pattern typically indicates a potential bullish reversal, there is a similar pattern called the “hanging man.” The hanging man appears after an uptrend and can signal a potential bearish reversal, making it the opposite of a bullish hammer.
How do you read a hammer candlestick?
To read a hammer candlestick, look for these characteristics:
- A small real body near the top of the price range.
- A long lower shadow (tail) extending below the body.
- Little or no upper shadow. The hammer suggests that sellers initially pushed prices lower, but buyers regained control by the close, indicating potential bullish momentum.
Can a bullish hammer be red?
Yes, a bullish hammer can be red (bearish) in color. What matters more is the context and its position within the price trend. A red bullish hammer after a downtrend can still signal a potential reversal, as long as other criteria of the pattern are met.
What if a hammer appears in an uptrend?
If a hammer appears in an uptrend, its significance as a bullish reversal signal is diminished. In this context, it might indicate a temporary pause or a minor retracement in the ongoing uptrend rather than a strong reversal.
Does the color of a hammer matter?
The color of a hammer (green or red) is not as important as its structure and its location within the price trend. The key focus should be on the pattern’s shape, the length of its shadows, and its position relative to the surrounding candles.
How accurate is the hammer candlestick?
The accuracy of the hammer candlestick pattern can vary. While it can provide valuable insights into potential reversals, its effectiveness depends on factors like market conditions, trend strength, and the presence of confirming indicators. It’s best used as part of a broader trading strategy.
What is the opposite of a bullish hammer?
The opposite of a bullish hammer is a bearish pattern known as the “shooting star.” A shooting star candlestick has a small real body near the bottom of the price range and a long upper shadow, indicating potential bearish reversal after an uptrend.
Candlestick patterns cheat sheet – free PDF
Dive into our comprehensive articles on Bearish candlestick patterns cheat sheet and Bullish candlestick patterns cheat sheet [free PDF cheat sheet included]. Discover how to recognize and utilize various bearish and bullish patterns to make informed trading decisions.
Final thoughts
The bullish hammer pattern is a valuable tool, but it’s most effective when integrated into a comprehensive trading strategy that considers technical, fundamental, and market sentiment factors.
While the bullish hammer can offer timely insights into potential trend reversals, your success ultimately hinges on your dedication to learning, adaptability, and disciplined execution.
So, whether you are a seasoned trader looking to refine your skills or an aspiring investor eager to gain an edge, the bullish hammer candlestick holds the promise of enhancing your decision-making prowess and guiding you toward profitable opportunities in the ever-evolving landscape of financial markets.