

Creating a balance sheet in Excel offers a convenient and flexible way to organize and calculate financial data. In this article, we will guide you through the process of how to create a balance sheet in excel, step by step.
Understanding the Balance Sheet
Before diving into the technical aspects of building a balance sheet in Excel, let’s ensure we have a clear understanding of its purpose and components.
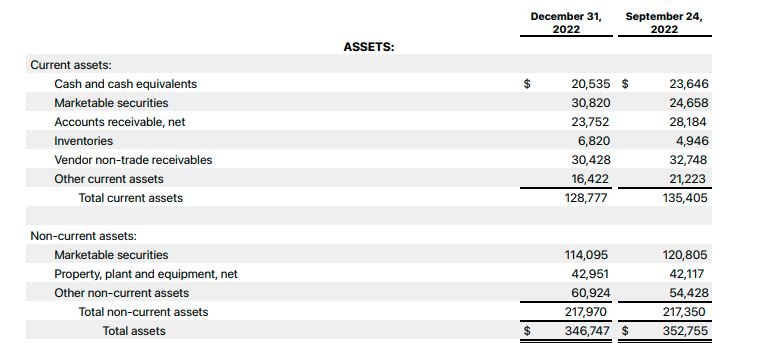
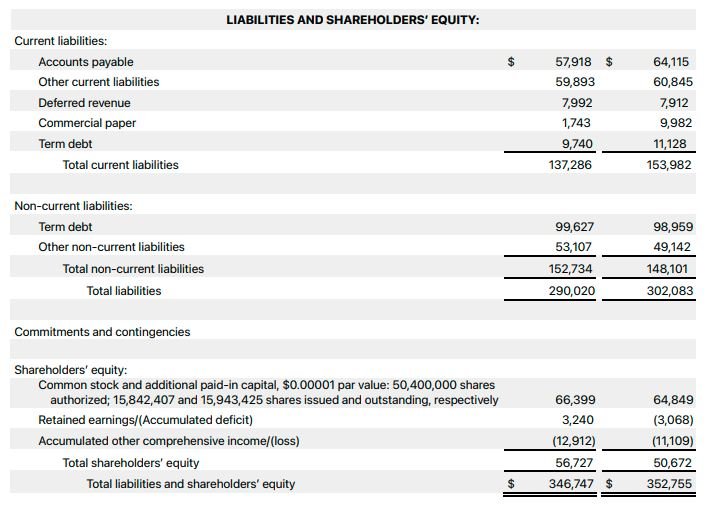
A balance sheet is divided into three main sections: assets, liabilities, and equity.
Assets represent what the company owns, liabilities indicate its debts and obligations, and equity represents the residual interest or ownership of the company’s shareholders.
This financial statement provides crucial information for evaluating a company’s solvency, liquidity, and overall financial performance.
1. Setting up the excel spreadsheet
To create a balance sheet in Excel, you will need to start by setting up a new workbook. Open Microsoft Excel and create a new file. Name the file appropriately, such as “Balance Sheet Template.” Next, you will want to label the necessary columns and rows to structure your balance sheet effectively.
In the first column, label the rows as follows:
- Row 1: Company Name
- Row 2: Balance Sheet
- Row 3: Date
For assets, now label the rows as:
- Row 5: Assets
- Row 6 onwards: List the specific asset categories, such as Current Assets, Fixed Assets, and so on.
For liabilities, label the rows as:
- Row 5: Liabilities
- Row 6 onwards: List the specific liability categories, such as Current Liabilities, Long-term Liabilities, and more.
For equity, label the rows as:
- Row 5: Equity
- Row 6 onwards: List the specific equity components, such as Owner’s Equity and Retained Earnings.
By structuring your balance sheet in this manner, you will create a clear and organized framework to input your financial data accurately.
2. Entering the balance sheet data
Now that we have our Excel spreadsheet set up with the necessary labels, it’s time to start entering the balance sheet data. We will begin with the assets section.
Inputting asset information
Start with the “Assets” section in your balance sheet. Begin by listing the different asset categories under the “Assets” row, such as “Current Assets” and “Fixed Assets.” For each asset category, create separate rows to input the specific asset items.
Current Assets
Under the “Current Assets” section, list items such as cash, accounts receivable, inventory, and other short-term assets. Enter the corresponding values in the respective rows.
Fixed Assets
Moving on to the “Fixed Assets” section, include items like property, plant, and equipment (PP&E), vehicles, machinery, and any other long-term assets. Enter the values in the corresponding rows.
Recording Liabilities
After completing the asset section, let’s focus on recording the liabilities.
Current Liabilities
Under the “Liabilities” section, create rows for “Current Liabilities.” This includes obligations that are due within one year, such as accounts payable, accrued expenses, and short-term loans. Enter the values accordingly.
Long-term Liabilities
Next, create rows for “Long-term Liabilities.” These are obligations that extend beyond one year, such as long-term loans, mortgages, and bonds payable. Input the respective values in the designated rows.
Calculating Equity
The final section to complete is the equity section.
Owner’s Equity
In the “Equity” section, create a row for “Owner’s Equity.” This represents the owner’s or shareholders’ investments in the company. Enter the corresponding value.
Retained Earnings
Additionally, include a row for “Retained Earnings.” This represents the accumulated profits or losses that the company has retained over time. Enter the appropriate value.
By systematically entering the data for assets, liabilities, and equity, you will populate your balance sheet in Excel accurately.
3. Formatting the balance sheet
Once you have entered the data, it’s essential to format your balance sheet to enhance readability and presentation. Proper formatting can make it easier for readers to interpret the information effectively.
Adjusting column width and row height
Resize the columns and rows to ensure that the data fits comfortably within each cell. Double-click on the divider between the columns or rows and adjust as needed.
Applying cell formatting
Consider applying formatting options to improve the visual appeal and clarity of the balance sheet. You can make use of bold formatting to highlight headers or important figures. Additionally, apply currency formatting to monetary values, making it easier to read and understand the numbers.
Adding borders and shading
Using borders and shading can help to visually separate different sections of the balance sheet. Apply borders around the asset, liability, and equity sections to create clear distinctions. You may also choose to add shading to alternating rows, further enhancing readability.
4. Performing Calculations
Now that you have entered the data and formatted your balance sheet, it’s time to perform calculations to ensure accuracy and verify that the balance sheet equation holds true.
Summing up asset and liability sections
In Excel, you can use formulas to automatically calculate the total values for the asset and liability sections. For example, under the “Current Assets” section, use the SUM function to add up all the individual asset items. Repeat this process for the “Fixed Assets” section and each liability section, such as “Current Liabilities” and “Long-term Liabilities.”
Calculating total equity
To calculate the total equity, add the values of “Owner’s Equity” and “Retained Earnings” using appropriate formulas. This will provide you with the combined equity value.
Verifying balance sheet equality
A key aspect of a balance sheet is that it must balance—meaning the total assets must equal the total liabilities plus equity. Create a formula at the end of your balance sheet to verify this equality. Subtract the sum of liabilities and equity from the sum of assets. If the resulting value is zero or very close to zero (due to rounding), your balance sheet is in balance.
By performing these calculations, you can ensure the accuracy and integrity of your balance sheet in Excel.
5. Reviewing and analyzing the balance sheet
With your balance sheet created in Excel, it’s important to review and analyze the financial information it presents. This analysis can provide valuable insights into a company’s financial health and performance.
Double-checking data accuracy
Before drawing conclusions from your balance sheet, double-check that all the data has been entered correctly. Verify that the numbers align with the corresponding assets, liabilities, and equity items. Review formulas and calculations for any errors or inconsistencies.
Analyzing financial ratios and indicators
Utilize financial ratios and indicators derived from your balance sheet to assess the financial position of the company. For example, you can calculate the current ratio (current assets divided by current liabilities) to evaluate short-term liquidity. Similarly, analyze the debt-to-equity ratio (total liabilities divided by total equity) to understand the company’s leverage.
Interpreting the overall financial health
By examining the balance sheet’s figures and ratios, you can gain insights into the overall financial health of the company. Look for trends, compare values over time, and benchmark against industry standards to make informed assessments. Identify strengths, weaknesses, and areas that may require attention or improvement.
Additional tips for creating a balance sheet in excel
- Maintain consistency in formatting and labeling throughout your balance sheet
- Utilize data validation techniques in Excel to prevent errors when entering data.
- Regularly update your balance sheet to reflect the most recent financial information.
- Consider protecting your balance sheet to prevent accidental changes or unauthorized access.
- Perform sensitivity analysis by changing certain values in your balance sheet to assess their impact on the overall financial position.
- Utilize Excel’s error checking features to identify any potential errors or inconsistencies in your balance sheet.
- Keep a record of your balance sheet creation process, including any assumptions made or adjustments applied. This documentation aids in transparency, auditability, and future reference.
6. Incorporating visual elements
While the primary focus of a balance sheet is on accurate financial data, incorporating visual elements can enhance its presentation and make it more engaging for readers.
Excel provides several tools that can help you create visually appealing balance sheets.
Charts and graphs
Bar charts, pie charts, and line graphs can effectively illustrate the composition of assets, liabilities, and equity. These visual representations make it easier for readers to grasp the relative proportions and trends in the financial data.
Conditional formatting
You can use color scales to indicate the magnitude of values, such as larger values appearing in darker shades. This visual distinction draws attention to important information and facilitates data analysis.
Data table
You can use data tables to display detailed breakdowns of asset categories, liability components, or equity components. This enables readers to explore the data at a granular level and gain deeper insights into the financial position.
Visual enhancements should not compromise the integrity of the financial data or make it difficult for readers to interpret the information.
Sample Balance Sheet template
Company Name: ABC Corporation
Balance Sheet
As of December 31, 2022

Assets
Current Assets:
   Cash and Cash Equivalents:       $50,000
   Accounts Receivable:             $75,000
   Inventory:                       $100,000
   Prepaid Expenses:                $10,000
   Total Current Assets:            $235,000

Fixed Assets:
   Property, Plant, and Equipment:  $500,000
   Less: Accumulated Depreciation:  ($150,000)
   Net Fixed Assets:                $350,000

Total Assets:                       $585,000

Liabilities
Current Liabilities:
   Accounts Payable:                $30,000
   Short-term Loans:                $20,000
   Accrued Expenses:                $15,000
   Total Current Liabilities:       $65,000

Long-term Liabilities:
   Long-term Loans:                 $150,000
   Bonds Payable:                   $100,000
   Total Long-term Liabilities:      $250,000

Total Liabilities:                  $315,000

Equity
Owner's Equity:
   Common Stock:                    $100,000
   Retained Earnings:               $170,000
   Total Owner's Equity:            $270,000

Total Liabilities and Equity:       $585,000
Final thoughts
We hope this article has provided you with a comprehensive understanding of how to create a balance sheet in Excel. By following the outlined steps, you can confidently generate accurate and visually appealing balance sheets that effectively communicate a company’s financial position.